 Formatting Charts,Plot,Axis, Legend, Gridlines,Data Series Area

When
you are satisfied with your chart, you can customize the chart by formatting
the following:
1-Chart
Area 5- Axis
2- Chart Title 6- Legend
3- Plot Area 7- Gridlines
4- Axis 8- Data Series
»Formatting the
Chart Area
1- Select the chart whose chart area you want to format.
2- From the Chart toolbar, click the Chart
Objects down arrow, select Chart Area.
3- From the format menu, select the Selected
Chart Area command:

4-
From the Format Chart Area dialog box, click
on one of the following tabs to customize your chart:

● Patterns: Select the options you want to format the
Border and Area of the chart.
● Font: Select the options you want to set the
chart’s default or base Font. (You can change the font for each
different label as needed.)
● Properties :Choose the properties you want for the
positioning, printing, and locking of the chart.
»Formatting the
Plot Area
1- Select the chart whose plot area you want to format.
2- From the Chart toolbar, click the Chart
Objects down arrow, select Plot Area.
3-
From the format menu, select the Selected
Plot Area command to display the Format Plot Area dialog
box, and then customize your plot area:

»Formatting the
Axis
1- Select the chart whose axis you want to format.
2- From the Chart toolbar, click the Chart
Objects down arrow, select Category Axis.
3- From the format menu, select the Selected Axis
command.
4-
From the Format
Axis dialog box, click on one of the following
tabs to customize your
chart
axis:

● Patterns: Select the options you want to format
the Lines, Major tick mark,
Minor tick mark, and Tick mark labels of the axis.
● Scale: Select the options you want to define
the Scale of the axis.
● Font: Select the options you want to set the Font of the axis labels.
● Number: Select the options you want to format the
Number of the axis labels.
● Alignment: Select the options you want to set the Alignment of the axis labels.
»Formatting the
Axis Title
1-
Select the chart whose axis
title you want to format.
2- From the Chart
toolbar, click the Chart Objects down
arrow, select Category Axis Title to format the X axis title or Value Axis
Title for the Y axis title
3-
From the format menu, select
the Selected Axis Title command.
4- From the Format
Axis Title dialog box, click on one of the following tabs to customize your
chart axis title:

●Patterns: Select the options you want to format
the Border and Area of the axis title.
● Font: Select the options you want to set the Font
of the axis title.
● Alignment: Select the options you want to set the
Alignment of the axis title.
»Formatting the
Legend
1-
Select the chart whose legend
you want to format.
2-
From the Chart toolbar, click
the Chart Objects down arrow, select Legend.
3-
From the format menu, select
the Selected Legend command.
4- From the Format
Legend dialog box, click on one of the following tabs to customize your chart
legend:
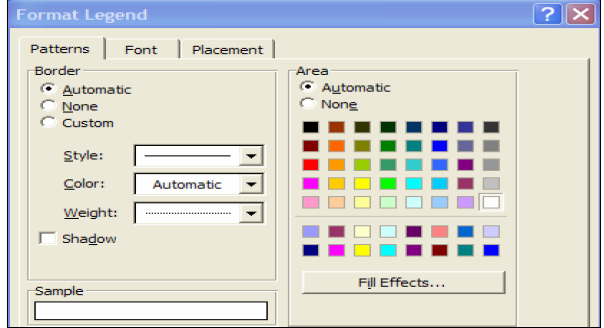
● Patterns: Select the options you want to format the Border and Area of the legend.
● Font: Select the options you want to set the Font of the legend.
● Placement: Select the options you want to set the Placement of the legend.
»Formatting the
Gridlines
1-
Select the chart whose
gridlines you want to format.
2- From the Chart toolbar, click the Chart Objects
down arrow; select Category
Axis Gridlines to format the
vertical gridlines or Value
Axis Gridlines for the horizontal gridlines.
3-
From the format menu, select the Selected Gridlines command.
4- From the Format Gridlines dialog box, click on one of the following
tabs to customize your chart gridlines:

● Patterns: Select the options you want to format the Border and Area of the gridlines.
● Scale: Select the
options you want to define the Scale of the gridlines.
»Formatting the
Data Series
1-
Select the chart whose data
series you want to format.
2- From the Chart
toolbar, click the Chart Objects down arrow; select the Series you want to
format.
3-
From the format menu, select
the Selected Data Series command.
4- From the
Format Data Series dialog box, click on one of the following tabs to customize your
chart data series:
● Patterns: Select the options you want to format the Border and Area of the dataseries.
● Axis: Choose to plot the series on the Primary or Secondary axis.
● Y Error Bars: Select the options you want to display
and format the Error Bars.
● Data Labels: Select the options you want to display
and format the Data Labels.
● Series Order: You can control the order in which the
data series is displayed. Select the data series you want to change, and click
the Move Up or Move Down button.
● Options: Allows you to control the Overlap
between the data series and the Gap width
between categories.
No comments:
Post a Comment